

Exercise 1: Pandas: DataFrame and Series
Pandas is a popular library for data analysis built on top of the Python programming language. Pandas generally provide two data structures for manipulating data, They are:
- DataFrame
- Series
A DataFrame is a two-dimensional data structure, i.e., data is aligned in a tabular fashion in rows and columns.
- A Pandas DataFrame will be created by loading the datasets from existing storage.
- Storage can be SQL Database, CSV file, an Excel file, etc.
- It can also be created from the lists, dictionary, and from a list of dictionaries.
Series represents a one-dimensional array of indexed data. It has two main components :
- An array of actual data.
- An associated array of indexes or data labels.
The index is used to access individual data values. You can also get a column of a dataframe as a Series. You can think of a Pandas series as a 1-D dataframe.
# let us import the Pandas Library
import pandas as pd
Once you’ve imported pandas, you can then use the functions built in it to create and analyze data.
In this practice lab, we will learn how to create a DataFrame out of a dictionary.
Let us consider a dictionary 'x' with keys and values as shown below.
We then create a dataframe from the dictionary using the function pd.DataFrame(dict)
#Define a dictionary 'x'

x = {'Name': ['Rose','John', 'Jane', 'Mary'], 'ID': [1, 2, 3, 4], 'Department': ['Architect Group', 'Software Group', 'Design Team', 'Infrastructure'],
      'Salary':[100000, 80000, 50000, 60000]}

#casting the dictionary to a DataFrame
df = pd.DataFrame(x)

#display the result df
df
| Name | ID | Department | Salary | |
|---|---|---|---|---|
| 0 | Rose | 1 | Architect Group | 100000 |
| 1 | John | 2 | Software Group | 80000 |
| 2 | Jane | 3 | Design Team | 50000 |
| 3 | Mary | 4 | Infrastructure | 60000 |
We can see the direct correspondence between the table. The keys correspond to the column labels and the values or lists corresponding to the rows.
Column Selection:
To select a column in Pandas DataFrame, we can either access the columns by calling them by their columns name.
Let's Retrieve the data present in the ID column.
#Retrieving the "ID" column and assigning it to a variable x
x = df[['ID']]
x
| ID | |
|---|---|
| 0 | 1 |
| 1 | 2 |
| 2 | 3 |
| 3 | 4 |
Let's use the type() function and check the type of the variable.
#check the type of x
type(x)
pandas.core.frame.DataFrame
The output shows us that the type of the variable is a DataFrame object.
Access to multiple columns
Let us retrieve the data for Department, Salary and ID columns
#Retrieving the Department, Salary and ID columns and assigning it to a variable z

z = df[['Department','Salary','ID']]
z
| Department | Salary | ID | |
|---|---|---|---|
| 0 | Architect Group | 100000 | 1 |
| 1 | Software Group | 80000 | 2 |
| 2 | Design Team | 50000 | 3 |
| 3 | Infrastructure | 60000 | 4 |
Try it yourself
Problem 1: Create a dataframe to display the result as below:
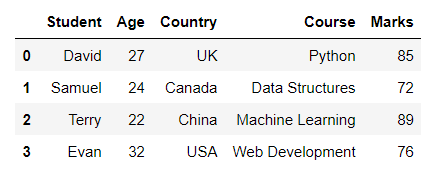
#write your code here
# a = {'Student':['David', 'Samuel', 'Terry', 'Evan'],
#      'Age':['27', '24', '22', '32'],
#      'Country':['UK', 'Canada', 'China', 'USA'],
#      'Course':['Python','Data Structures','Machine Learning','Web Development'],
#      'Marks':['85','72','89','76']}
# df = pd.DataFrame(a)
# df
Click here for the solution
a = {'Student':['David', 'Samuel', 'Terry', 'Evan'],
     'Age':['27', '24', '22', '32'],
     'Country':['UK', 'Canada', 'China', 'USA'],
     'Course':['Python','Data Structures','Machine Learning','Web Development'],
     'Marks':['85','72','89','76']}
df = pd.DataFrame(a)
df
Problem 2: Retrieve the Marks column and assign it to a variable b
#write your code here
# df_m = df[['Marks']]
# df_m
# df to a list
# l = df_m.values.tolist()
# l
# l[0]
Click here for the solution
b = df[['Marks']]
b
Problem 3: Retrieve the Country and Course columns and assign it to a variable c
# #write your code here
# c = df[['Country','Course']]
# c
Click here for the solution
c = df[['Country','Course']]
c
To view the column as a series, just use one bracket:
# Get the Name column as a series Object

x = df['Name']
x
0    Rose
1    John
2    Jane
3    Mary
Name: Name, dtype: object
#check the type of x
type(x)
pandas.core.series.Series
The output shows us that the type of the variable is a Series object.
Exercise 2: loc() and iloc() functions
loc() is a label-based data selecting method which means that we have to pass the name of the row or column that we want to select. This method includes the last element of the range passed in it.
Simple syntax for your understanding:
- loc[row_label, column_label]
iloc() is an indexed-based selecting method which means that we have to pass integer index in the method to select a specific row/column. This method does not include the last element of the range passed in it.
Simple syntax for your understanding:
- iloc[row_index, column_index]
Let us see some examples on the same.
# Access the value on the first row and the first column

df.iloc[0, 0]
'Rose'
# Access the value on the first row and the third column

df.iloc[0,2]
'Architect Group'
# Access the column using the name

df.loc[0, 'Salary']
100000
Let us create a new dataframe called 'df1' and assign 'df' to it. Now, let us set the "Name" column as an index column using the method set_index().
df1=df
df1=df1.set_index("Name")
#To display the first 5 rows of new dataframe
df1.head()
| ID | Department | Salary | |
|---|---|---|---|
| Name | |||
| Rose | 1 | Architect Group | 100000 |
| John | 2 | Software Group | 80000 |
| Jane | 3 | Design Team | 50000 |
| Mary | 4 | Infrastructure | 60000 |
#Now, let us access the column using the name
df1.loc['Jane', 'Salary']
50000
Try it yourself
Use the loc() function,to get the Department of Jane in the newly created dataframe df1.
#write your code here
df1.loc['Jane', 'Department']
'Design Team'
Click here for the solution
df.loc[['Jane', 'Department']]
Use the iloc() function,to get the Salary of Mary in the newly created dataframe df1.
#write your code here
df1.iloc[3, 2]
60000
Click here for the solution
df1.iloc[3,2]
Exercise 3: Slicing
Slicing uses the [] operator to select a set of rows and/or columns from a DataFrame.
To slice out a set of rows, you use this syntax: data[start:stop],
here the start represents the index from where to consider, and stop represents the index one step BEYOND the row you want to select. You can perform slicing using both the index and the name of the column.
NOTE: When slicing in pandas, the start bound is included in the output.
So if you want to select rows 0, 1, and 2 your code would look like this: df.iloc[0:3].
It means you are telling Python to start at index 0 and select rows 0, 1, 2 up to but not including 3.
NOTE: Labels must be found in the DataFrame or you will get a KeyError.
Indexing by labels(i.e. using loc()) differs from indexing by integers (i.e. using iloc()). With loc(), both the start bound and the stop bound are inclusive. When using loc(), integers can be used, but the integers refer to the index label and not the position.
For example, using loc() and select 1:4 will get a different result than using iloc() to select rows 1:4.
We can also select a specific data value using a row and column location within the DataFrame and iloc indexing.
# let us do the slicing using old dataframe df

df.iloc[0:2, 0:3]
| Name | ID | Department | |
|---|---|---|---|
| 0 | Rose | 1 | Architect Group |
| 1 | John | 2 | Software Group |
#let us do the slicing using loc() function on old dataframe df where index column is having labels as 0,1,2
df.loc[0:2,'ID':'Department']
| ID | Department | |
|---|---|---|
| 0 | 1 | Architect Group |
| 1 | 2 | Software Group |
| 2 | 3 | Design Team |
#let us do the slicing using loc() function on new dataframe df1 where index column is Name having labels: Rose, John and Jane
df1.loc['Rose':'Jane', 'ID':'Department']
| ID | Department | |
|---|---|---|
| Name | ||
| Rose | 1 | Architect Group |
| John | 2 | Software Group |
| Jane | 3 | Design Team |
Try it yourself
using loc() function, do slicing on old dataframe df to retrieve the Name, ID and department of index column having labels as 2,3
# Write your code below and press Shift+Enter to execute
df.loc[2:3, 'Name':'Department']
| Name | ID | Department | |
|---|---|---|---|
| 2 | Jane | 3 | Design Team |
| 3 | Mary | 4 | Infrastructure |
Click here for the solution
df.loc[2:3,'Name':'Department']